
Gladstone Commercial Corp is a real-estate investment trust (REIT) that primarily focuses on acquiring, owning, and managing single tenant and anchored multitenant net-leased office and industrial properties. The Company also has the capacity to make long-term industrial and commercial mortgage loans to companies of various industries across the United States. Gladstone’s investment portfolio consists of real-estate properties that are leased to tenants with small- to mediumsized unrated businesses and larger rated
businesses, occupied by companies
controlled by buyout funds, and are
purchased from and leased back to
businesses that are seeking to raise capital. GOOD IPO’d on the NASDAQ in 2003 under the trading symbol GOOD and is currently headquartered in McLean, Virginia.
Company Updates
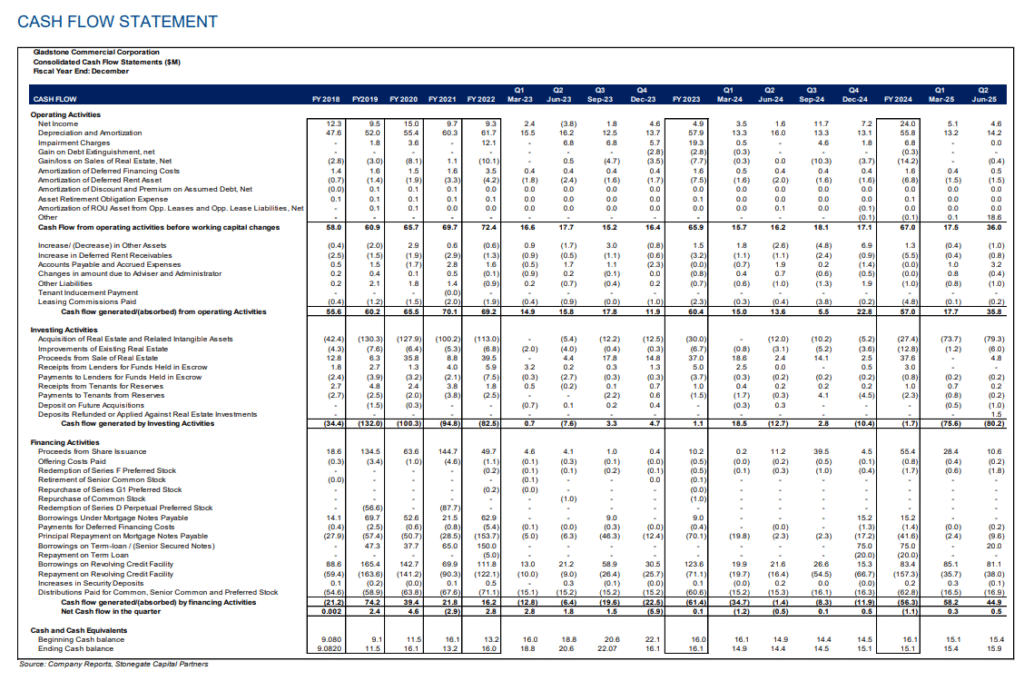
Transactions: In the second quarter of 2025, Gladstone Commercial Corp. maintained its disciplined portfolio management approach. The Company ended the quarter with 143 properties across 27 states, expanding its footprint from the previous quarter. During 2Q25, GOOD executed its capital recycling strategy by selling two non-core properties, for a combined $23.6M. Additionally, the Company expanded its portfolio by acquiring properties totaling 519,093 square feet for $79.3M, at a blended cap rate of 8.88%. In the same period, the Company leased or renewed 55,308 square feet with a remaining lease term of 0.8 years. These strategic moves underscore GOOD’s ongoing emphasis on industrial assets while maintaining liquidity and reducing exposure to non-core properties.
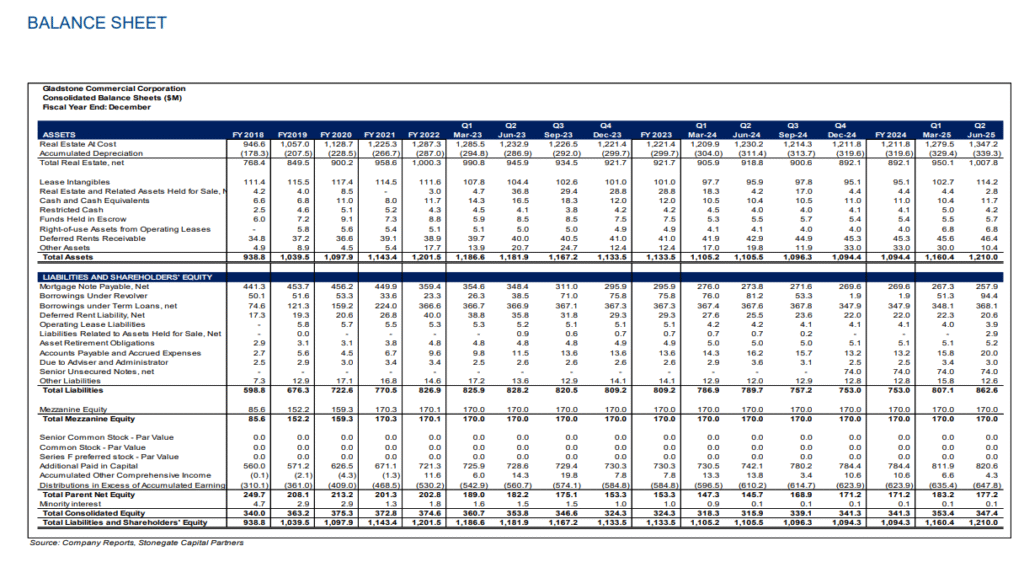
Strengthened Liquidity and Capital Resources: Gladstone reported total liquidity of approximately $38.7M in 2Q25, consisting of $11.7M in cash and cash equivalents and $27.0M in borrowing capacity under its revolving credit facility. This liquidity position represents a 18.3% y/y decrease, primarily due to a draw on the revolver. These measures reflect the company’s approach to maintaining flexibility while optimizing its debt structure.
Fundamentals Remain Strong: GOOD continues to demonstrate strong
operational fundamentals, maintaining a high occupancy rate of 98.7% as of 2Q25, flat from 4Q24. The Company also reported 100% cash rent collectionin
the quarter, showcasing its stable tenant base and strong leasing activity.
Renewal and Leasing activity remained stable in 2Q25 despite broader
economic uncertainty, with 55,308 square feet leased or renewed at a single
property, reflecting an average remaining lease term of 0.8 years. The
portfolio’s weighted average lease term was 7.1 years, reflecting the
Company’s ability to secure long-term leases with creditworthy tenants.
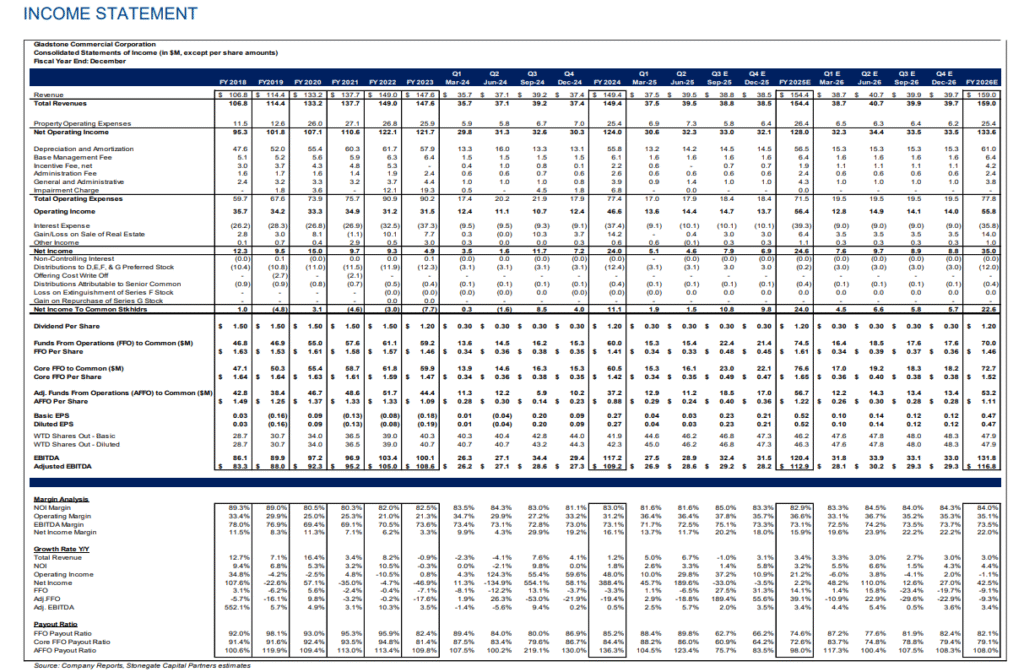
Quarterly Results: GOOD reported revenue, FFO per share, and AFFO per
share of $39.5M, $0.33, and $0.24, respectively. This compares to
our/consensus estimates of $38.1M/$38.3M, $0.36/$0.35, and $0.22/$0.26.
Core FFO for the quarter was $0.35 per share, up from $0.34 in 1Q25.
Improving Diversification: GOOD continues its strategic shift toward
industrial properties, reducing exposure to office assets. As of 2Q25, the
Company’s portfolio composition, based on annualized straight-line rent,
consisted of 67% industrial properties and 29% office properties, maintaining
its trajectory from the previous quarter and up from 63% industrial assets at
year-end FY24. The shift underscores the Company’s focus on acquiring
resilient, long-duration, single-tenant net lease industrial properties.
Payout Ratios: The Company currently pays a 9.2% dividend yield, paying
out an annualized $1.20 per share. Based on a 2Q25 per share values for
FFO of $0.33, Core FFO of $0.35, and AFFO of $0.24 GOOD has payout
ratios of 90%, 86%, and 123% respectively. Valuation: We use a combination of comp analysis, Revalued NAV (reNAV) per share analysis, and a Perpetual Growth Model based on the most recent FFO Payout Ratio to frame our valuation of GOOD. When we average these valuation methods it returns a valuation range of $14.84 to $16.86 with a mid-point of $15.84.

Business Overview
Gladstone Commercial Corp (“Good” or “The Company”) is a real-estate investment trust (REIT) that primarily focuses on acquiring, owning, and managing single tenant and anchored multi-tenant industrial and office properties. The Company also has the capacity to make long-term industrial and commercial mortgage loans to companies of various industries across the United States. Gladstone’s investment portfolio consists of real-estate properties that are leased to tenants with small- to medium-sized unrated businesses and larger rated businesses, occupied by companies controlled by buyout funds, and are purchased from and leased back to businesses that are seeking to raise capital. As of June 30, 2025, Gladstone owned 143 properties totaling 17.0 million square feet, located in 27 states. GOOD IPO’d on the NASDAQ in 2003 under the trading symbol GOOD and is currently headquartered in McLean, Virginia.

Acquisitions are a key component of Gladstone’s business. Management is highly selective in its acquisitions, focusing on candidates with accretive returns that are in targeted growth markets and are accretive to the portfolio. As of 4Q24, GOOD’s total assets were ~$1.2B, increasing approximately 18% since 2017. In 2018, Gladstone began shifting its focus to acquiring industrial assets in attractive growth markets with long-term net leases to credit tenants. As of 1Q25, 65% of the portfolio is based in industrial assets, up from 39% at the end of FY19.

Gladstone is led by an extensively experienced management team with a combined industry experience of over 130 years. Management’s background involves buying, leasing, and owning office and industrial real estate, as well as a vast knowledge of lending and investing in middle market and larger operating companies. At the helm is founder and CEO David Gladstone who has extensive experience including commercial lending, investing, and buyout scenarios, and Buzz Cooper who has been with the Company for over 20 years and whose experience includes asset and property acquisitions, buying loans from RTC and making real estate backed loans. Market Strategy Gladstone has a market strategy driven by a highly diversified portfolio, stable income streams, selective underwriting, predictable cash flows from quality assets, and matching long-term leases with long-term fixed rate debt. These elements are crucial to GOOD’s investment philosophy and have allowed the Company to maintain a stable portfolio and strong balance sheet, which positions GOOD to continue making strategic acquisitions.
Highly Diversified Portfolio:
Gladstone prioritizes tenants that are diversified by geography, industry, property type, and by size, ranging from small private companies to large publicly traded corporations. These larger public tenants include General Motors (NYSE: GM), Automatic Data Processing, Inc. (NasdaqGS: ADP), and T-Mobile US, Inc. (NasdaqGS: TMUS). Midsize tenants occupying properties ranging from 30- 150K SF (office) and 75-500K SF (industrial) are the portfolio’s primary focus. GOOD’s tenants represent 20 different industries such as automotive, telecommunications, diversified services as well as building and real estate, which make up 16%, 9%, 11%, and 9% of the portfolio, respectively. Moreover, the group is geographically diverse, spreading across 27 U.S. states shown in exhibit 3.
This diversity has aided GOOD to maintain stability and mitigate risks.

Stable Income Streams:
The Company targets growth markets across the U.S. to accumulate assets in specific markets to create valuable portfolios. This strategy emphasizes submarkets with strong economic components, including population growth, a diverse industry base, constrained supply, and high barriers to entry. These promising growth markets present GOOD with a stable income stream that strengthens the portfolio.
Selective Underwriting:
Gladstone analyzes potential acquisitions by considering potential tenant strength based off financial statements, capital structures, credit ratings, management experience, industry fundamentals, and their ability to withstand downturns, as well as assessing markets poised for growth, asset quality, and focused transactions. This is a proven strategy that has led to consistently strong growth. As a result, GOOD’s occupancy is now at 98.7% and has never fallen below 95% since IPO in 2003.
Predictable Cash from Quality Assets:
The portfolio contains quality assets with flexible configurations that are critical to their tenants’ operations. Gladstone targets net leases with 7+ years remaining once acquired. These properties include single tenant and anchored multi-tenant office and industrial properties. Industrial properties have progressively become the management’s priority and now make up 65% of the portfolio. Historically, GOOD acquires triple net (NNN) leases, which requires tenants to pay rent, plus all of the taxes, property insurance and maintenance/repair costs. The advantages of triple net leases include consistent cash flows with predictable returns and higher yields than comparable assets. Matching Long-term Leases with Long-term Fixed Rate Debt: Gladstone mitigates the risk against the possibility of both another recession and increasing interest rates by matching long-term leases with long-term fixed debt. From this, management has focused on deleveraging and refinancing debt at lower rates. Net debt as a percentage of gross assets was 44.9% in 4Q24, decreasing 1,310bps since 2014. There are significant opportunities to create savings through refinancing debt. The proceeds from refinancing debt help fuel GOOD’s acquisition pipeline.

Industry Overview
U.S. equity REITs experienced reduction in funds from operations (FFO) as a result of the Covid-19 pandemic. However, REITs quickly rebounded and even surpassed pre-pandemic levels. This plays into the fact that REITs historically outperform private real estate and the overall market during and after recessions, shown in exhibit 5. Companies across all industries have instituted return-to-work policies after a movement to work from home in 2020, which will increase broad occupancy rates going forward and thus lead to stronger leasing and operational performance for REITs going forward.

As of 4Q24, the most recent quarter with data, occupancy rates in the industrial sector are the highest amongst all industries at ~94.0%. Despite a plateau in starts and sales due to higher rates and economic uncertainty, industrial occupancy has persisted, and long-term demand remains positive. Comparatively, office space development has declined and there is a record high of office properties being demolished, redeveloped, or converted. The pivot to industrials properties bodes well for GOOD going forward as the Company continues to transition its portfolio to a higher concentration in industrial properties.

Risks
As with any investment, there are certain risks associated with GOODs operations as well as with the surrounding economic and regulatory environments common to the real estate industry. Competition – GOOD operates in a highly competitive industry with low barriers to entry. The Company competes with other REITs and lenders, some of whom have greater access to financial resources. Should GOOD lose out on quality properties in potential growth markets to its
competitors, its operations and ability to grow its portfolio are at risk.
Interest Rates – High interest rates have historically impacted the value of real estate. Considering REITs are significantly sensitive to volatile movements in interest rates as a result of their leverage, GOOD could see a reduction in the value of its assets as well as a rise in the cost of debt should rates remain volatile.
Tenants – Weakening economic conditions could cause GOOD’s tenants to be unable to meet lease obligations. Any failure to meet these obligations would result in a significant impact on GOOD’s operations.
Geography – The locations of GOOD’s geographic markets pose environmental and economic risks. Immobile hard assets are subject to environmental disasters such as forest fires, tornadoes, and earthquakes which could damage the properties.
VALUATION SUMMARY
We use a combination of comp analysis, reNAV per share analysis, and a Perpetual Growth Model based on the most recent FFO Payout Ratio to frame our valuation of GOOD. When we average these valuation methods it returns a valuation range of $14.84 to $16.86 with a mid-point of $15.84.

We are using an EV/EBITDA and Price/AFFO framework to inform our GOOD valuation. Currently GOOD is trading at a FY26 EV/EBITDA of 12.9x compared to comps at an average of 13.1x. We are using our FY26 expected EBITDA, and an EV/EBITDA range of 14.0x to 14.5x with a midpoint of 14.3x which moves GOOD closer to comp companies. This arrives at a valuation range of $16.12 to $17.38 with a mid-point of $16.75. For our Price/AFFO analysis, GOOD is trading at a FY26 multiple of 11.8x compared to comps at an average of 11.0x We are using our FY26 expected AFFO, and a Price/AFFO range of 13.0x to 14.0x with a midpoint of 13.5x This arrives at a valuation range of $14.44 to $15.55 with a mid-point of $15.00. For our NAV analysis we use a cap rate range of 7.75% and 8.25% Which we believe is reasonable given the Company’s recent transactions. This arrives at a reNAV/Share range of $15.78 to $18.03 with a mid-point of $16.87.


Finally, we look at a perpetual growth model to account for the recent reduction in dividends. Even when we apply the LTM reduced FFO payout ratio of 90% to our forward estimated FY26 FFO we still expect a payout per share of at least $1.32 which when used in a perpetual growth model returns a valuation range of $14.61 to $18.27 with a mid-point of $16.44. This conservative valuation approach still results in a premium to current price of 11.9% to 39.9% with a mid-point of 25.9%.

IMPORTANT DISCLOSURES AND DISCLAIMER
(a) The research analyst and/or a member of the analyst’s household do not have a financial interest in the debt or equity securities of the subject company.
(b) The research analyst responsible for the preparation of this report has not received compensation that is based upon Stonegate’s investment banking revenues.
(c) Stonegate or any affiliate have not managed or co-managed a public offering of securities for the subject company in the last twelve months, received investment banking compensation from the subject company in the last 12 months, nor expects or receive or intends or seek compensation for investment banking services from the subject company in the next three months.
(d) Stonegate’s equity affiliate, Stonegate Capital Partners, “SCP” has a contractual agreement with the subject company to provide research services, investor relations support, and investor outreach. SCP receives a monthly retainer for these non investment banking services.
(e) Stonegate or its affiliates do not beneficially own 1% or more of any class of common equity securities of the subject company.
(f) Stonegate does not make a market in the subject company.
(g) The research analyst has not received any compensation from the subject company in the previous 12 months.
(h) Stonegate, the research analyst, or associated person of Stonegate with the ability to influence the content of the research report knows or has reason to know of any material conflicts of interest at the time of publication or distribution of the research report.
(i) No employee of Stonegate has a position as an officer or director of the subject company.
Ratings – Stonegate does not provide ratings for the covered companies.
Distribution of Ratings – Stonegate does not provide ratings for covered companies.
Price Chart – Stonegate does not have, nor has previously had, a rating for its covered companies.
Price Targets – Stonegate does not provide price targets for its covered companies. However, Stonegate does
provide valuation analysis.
Regulation Analyst Certification:
I, Dave Storms, CFA, hereby certify that all views expressed in this report accurately reflect my personal views about the subject company or companies and its or their securities. I also certify that no part of my compensation was, is, or will be directly or indirectly related to the specific recommendations or views expressed in this report.
For Additional Information Contact:
Stonegate Capital Partners, Inc.
Dave Storms, CFA
Dave@stonegateinc.com
214-987-4121
Please note that this report was originally prepared and issued by Stonegate for distribution to their market professional and institutional investor customers. Recipients who are not market professional or institutional investor customers of Stonegate should seek the advice of their independent financial advisor prior to taking any investment decision based on this report or for any necessary explanation of its contents. The information contained herein is based on sources which we believe to be reliable but is not necessarily complete and its accuracy cannot be guaranteed. Because the objectives of individual clients may vary, this report is not to be construed as an offer or the solicitation of an offer to sell or buy the securities herein mentioned. This report is the independent work of Stonegate Capital Partners and is not to be construed as having been issued by, or in any way endorsed or guaranteed by, any issuing companies of the securities mentioned herein. The firm and/or its employees and/or its individual shareholders and/or members of their families and/or its managed funds may have positions or warrants in the securities mentioned and, before or after your receipt of this report, may make or recommend purchases and/or sales for their own accounts or for the accounts of other customers of the firm from time to time in the open market or otherwise. While we endeavor to update the information contained herein on a reasonable basis, there may be regulatory, compliance, or other reasons that prevent us from doing so. The opinions or information expressed are believed to be accurate as of the date of this report; no subsequent publication or distribution of this report shall mean or imply that any such opinions or information remains current at any time after the date of this report. All opinions are subject to change without notice, and we do not undertake to advise you of any such changes. Reproduction or redistribution of this report without the expressed written consent of Stonegate Capital Partners is prohibited.
Additional information on any securities mentioned is available on request.


